Rutgers University Fights Childhood Obesity: The Healthy HomeStyles Research Coalition and Project, Lectures by Dr. Carol Byrd-Bredbenner, PhD, RD, FAND, and Jennifer Martin-Biggers, MS, RD; April 2013/2014

Dr. Carol Byrd-Bredbenner, Ph.D., R.D., F.A.N.D., Professor, Department of Nutritional Sciences,
Extension Specialist in Community Nutrition
Rutgers University

Jennifer Martin-Biggers, M.S., R.D.
Department of Nutritional Sciences
Rutgers University
Dr. Byrd-Bredbenner’s research focuses on nutrition education and health promotion with the goal of promoting healthy lifestyles. Her research systematically studies the complex interplay of personal and environmental factors that influence dietary choices in order to enable health professionals to design effective programs that result in improved nutrition and health. Dr. Byrd-Bredbenner specifically studies obesity prevention, both in preschoolers and their families, and in college students.
Jennifer Martin-Biggers, MS, RD is a graduate student in Dr. Byrd-Bredbenner’s Research Group. Jennifer was a practicing dietitian who returned to graduate school to complete a doctorate in Nutrition in order to perform nutrition research.
Fighting Childhood Obesity in the US: The Healthy HomeStyles Research Study
Dr. Byrd-Bredbenner is part of a group of Nutrition researchers who are developing education and intervention strategies that will effectively improve nutrition and health in preschoolers and their families. To accomplish these goals, these researchers have established the Healthy HomeStyles Research Study, which is a Randomized Controlled Intervention Trial that will test a program that will enable and motivate parents in New Jersey and Arizona to change their home environments and lifestyle practices in order to prevent childhood obesity.
In brief, the Healthy HomeStyles Research Study will:
1) Develop & test educational programs and materials
2) Train in home teachers to perform face-to-face delivery of the program
3) Recruit families with preschoolers
4) Conduct a Randomized Controlled Trial to determine whether independent learning through a website education program is comparable in effectiveness to face to face instruction in the home.
Healthy HomeStyles Research Study Goals are to have families increase the following activities:
- Eat Together as a Family Often
- Promote Positive Family Mealtimes
- Tame the Effects of TV on Diet
- Rethink Beverage Choices
- Serve Age-Appropriate Portion Sizes
- Encourage More Fresh Vegetable Availability and Intake
- Encourage Cereal for Breakfast
- Promote Positive Parental Feeding Practices
- Set Aside Time for Fun, Active Family Playtime
- Trade Screen-time for Active Play
- Promote Adequate Sleep Duration
Summary
Dr. Byrd-Bredbenner’s research program is one of the efforts at Rutgers University that is fighting obesity. The Healthy HomeStyles Research Randomized Controlled Intervention Trial will allow the development of valuable, scientifically verified programs that will help the United States prevent childhood obesity.
The Website for the study is:
Below are the covers of two of the guides used in the Healthy HomeStyles Research Project.


Some recent articles from the Healthy HomeStyles Project:
Yorkin, M., Spaccarotella, K., Martin-Biggers, J., Quick, V., Byrd-Bredbenner, C. Accuracy and consistency of weights provided by home bathroom scales. BMC Public Health. 2013; 13:1194
http://www.biomedcentral.com/1471-2458/13/1194
Martin-Biggers, J., Beluska, K., Quick, V., Tursi, M., Byrd-Bredbenner, C. (In Press) Crafting cover lines to entice mothers to read health communications. Journal of Health Communications
Martin-Biggers, J., Spaccarotella, K., Hongu, N., Worobey, J., and Byrd-Bredbenner, C. Effects of family meals on health outcomes: A review. (In Press) Nutrition Reviews
Causes of the Obesity Epidemic in the United States; A Post by Joseph Dixon, April 12, 2014
After teaching/directing Obesity: Biology, Behavior, and Management for two semesters, I have attained an appreciation of the complexity of obesity and its causes and its effects on individuals and the population in general. Having taught Nutrition and Health for close to 25 years, I had a basic understanding of obesity, but I never went into a deep analysis of it. Quite honestly, it bored me. But after hearing all of the amazing and interesting lecturers we have had in class this semester, and the lecturers from last spring, too, I have become immensely interested in this field of nutrition. So much so that I started this blog on the topic! And after all of the lectures, and the discussions among the students and the guest lecturers, I have to start summing up what I think we learned this semester and what are the causes of the obesity epidemic in the United States. First and foremost, I think all of the students in the class would say that the causes of obesity are complex and many layered. I think it is helpful to break up the causes into age groups, as each age group has its own special circumstances and therefore, its own reasons for obesity in that particular group. The age groups for which the data are reported are:
Early childhood, 0 to 5 years old
Late childhood, 6 to 11 years old
Adolescents, 12 to 19 years old
Young adulthood, 20 to 39 years old
Full Adulthood, 40 to 59 years old
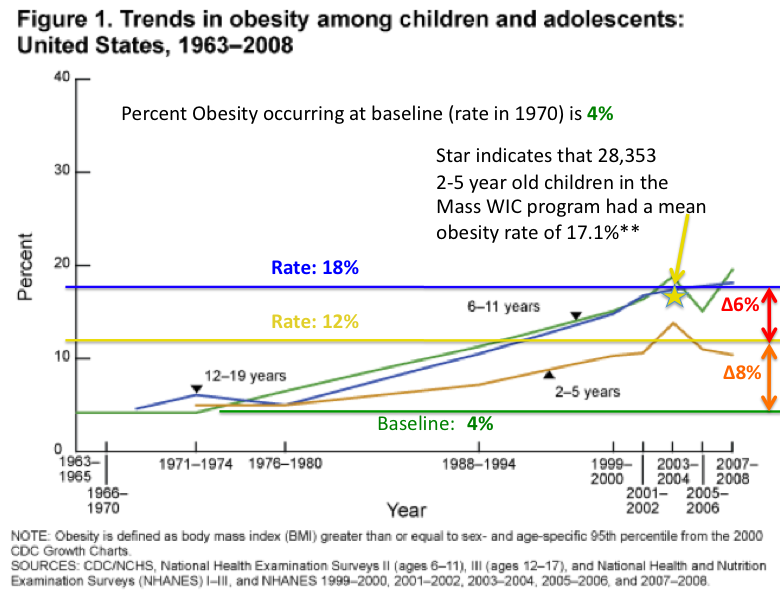
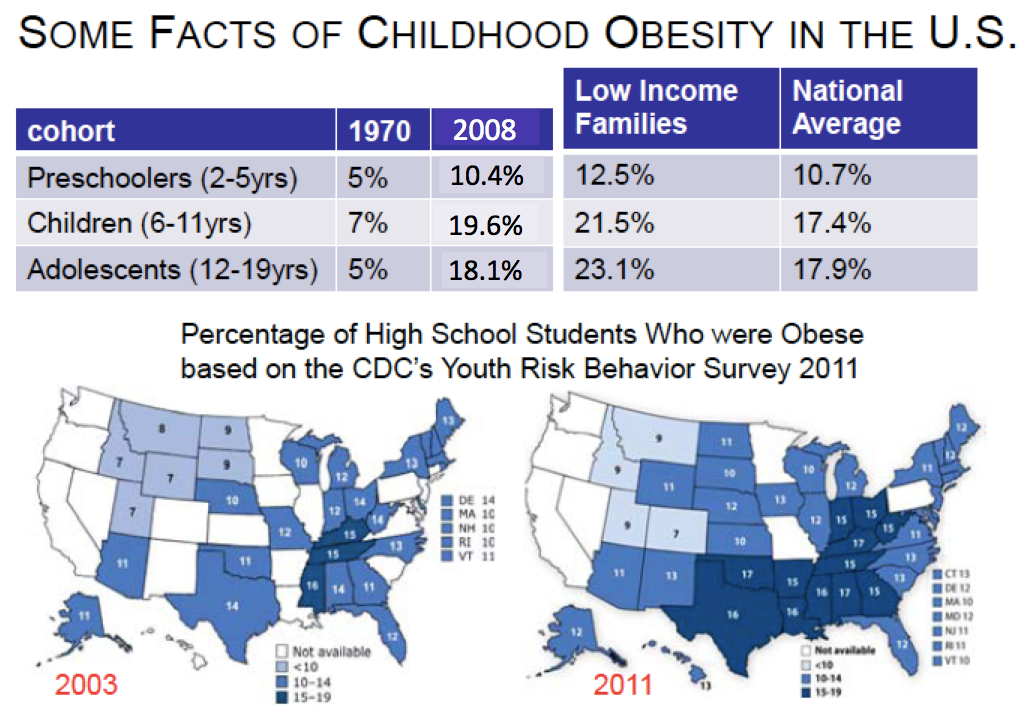
The slide below shows the increase in obesity in children and adolescents from 1963 to 2008. In the period from 1964 through about 1974, the baseline for obesity was about 4% of all children. Even during non-obesogenic times there were obese children. However, the obesity rate in 2 to 5 year old children steadily climbed until about 2005, when the obesity rate was about 12 %. Note that in 2003 (the golden star) the obesity rate in 28,353 children in the Mass WIC program was 17.1%, indicating that the obesity rate at lower economic levels is even higher than for the national rate (Gorman). The rate of obesity in 6 to 11 year old children also steadily climbed from 1974 to about 2005, when the rate was about 18%. The rate in 12-19 year old adolescents was very close to the rate observed in 6 to 11 year old children. These results very strongly relate that most obesity in childhood occurs by the age of 5 years old, and that the remaining increase occurs primarily in the 6 to 11 year old age period. Therefore, these are the periods that we need to be especially concerned about. It is still important to be concerned about the 12-19 year old group because these adolescents are susceptible to developing eating disorders.
Before we go much further, let’s discuss the “Standard Model” for the rise in Obesity in the United Sates, because some parts of it relate to the increased obesity in children. I call it the “Standard Model” because I do not think there is an official name for it, but I do believe most nutritionists I know consider most aspects of the “Standard Model” to be correct.
The “Standard Model” for the increase in obesity in the US- 5 major reasons for the obesity epidemic:
1.Due to the Green revolution in the US, the per capita availability of kcal is now about 3000 kcal per person per day, so companies have come up with innovative ways to sell these kcal in thousands of new products.
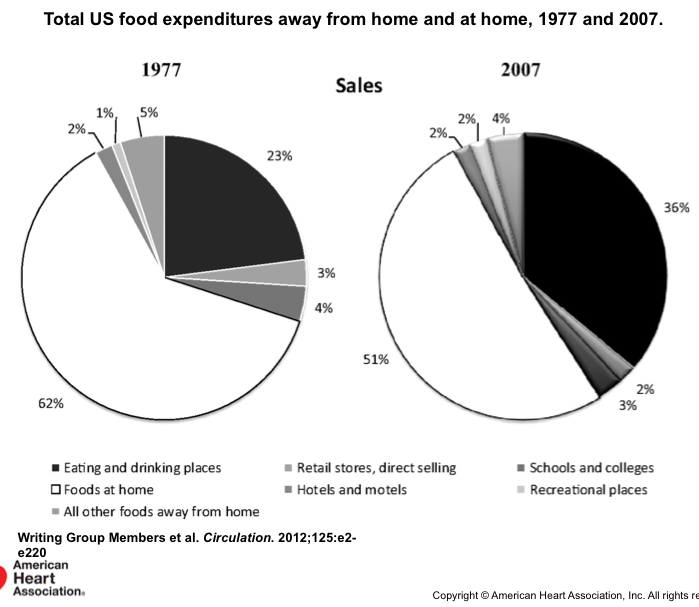
2.Therefore, there has been an expansion of high kcal product lines of every kind, as outlined by Michael Moss (See earlier blog post). These products populate the new generation of mega supermarkets. Also there has been a proliferation of major chain fast food restaurants, and “Mom and Pop” fast food restaurants that sell foods such as “Chinese take out,” fried chicken, and “Tex-Mex,” such that 50% of all food is eaten out of the home (See slide below). And don’t forget the modern shopping mall with its food court!
3. The explosion of income inequality in the US has forced people at the lower incomes levels to buy very cheap, calorie dense processed foods and snack foods, rather than more expensive healthy foods (See blog post on the SNAP program).
4. The explosion in the number of TV channels (now over 500 in some areas), and the introduction of the internet and computer games, have led, altogether, to much less physical activity in children and adults. In fact, James Levine of the Mayo Clinic, has observed that people who are obese stand or move 2 hr less per day than lean people.
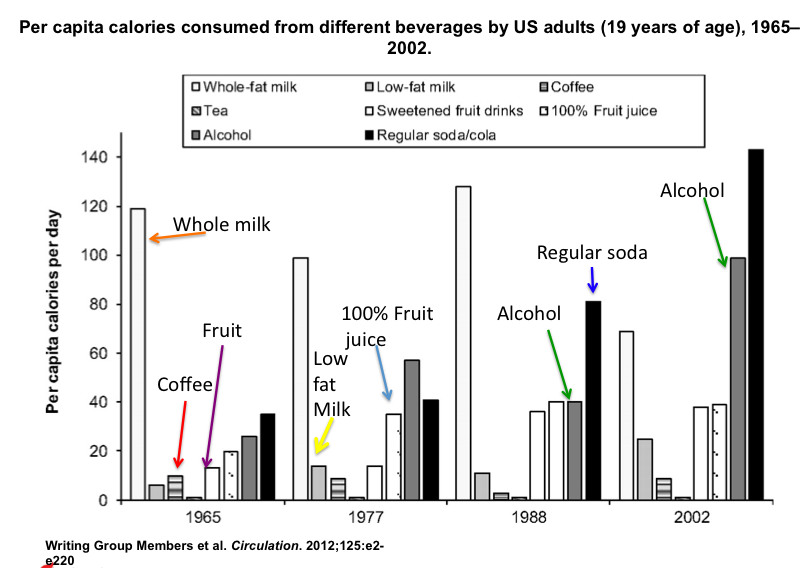
5. And finally, there is one reason (and this does not pertain to childhood obesity) that is rarely mentioned: the increase in per capita alcohol consumption, where alcohol intake has doubled in the US from 1988 to 2002 (See slide below). This increase is most likely due to the increase in the popularity of the NFL, of sports in general, and the sheer increase in the number of beer commercials. After all, ESPN was launched in September 1979 and has steadily increased in popularity. Other sports only networks have come on board in the past twenty years. The increased popularity of sports, and possibly the increased stress of everyday life, may have influenced the intake of alcohol by Americans. After all, this is another complex societal issue!
There are several other reasons (termed metabolic) that will be addressed later in this post.
The slide below indicates where Americans are eating their food.
One can read through the above reasons and understand how they could easily affect obesity in children. For example, young children in low and middle income homes may be “parked” in front of the TV for a good part of the day. While they are watching TV, they are given high calorie snack foods to eat in order to placate them. And then for dinner, a cheap high calorie meal is purchased from a fast food restaurant. Such a scenario could certainly explain the large increase in obesity in young children that we have observed.
Another reason for obesity that isn’t on the above list and that applies specifically to infants and very young children is that, now that we have been in the obesity epidemic for at least 20 – 25 years, obese mothers are now giving birth to very large babies that have a high probability of growing up obese. In fact, the article by Gorman’s group (see below) indicated that the strongest association with obesity observed in the 28,000 children (2 to 5 years old) in the MA WIC program was the birth weight of the infant.
Metallinos-Katsaras E, Must A, Gorman K. A longitudinal study of food insecurity on obesity in preschool children.
J Acad Nutr Diet. 2012 Dec;112(12):1949-58.
http://www.andjrnl.org/article/S2212-2672%2812%2901514-6/fulltext
(You will need to obtain the full article through Rutgers Libraries)
Adult Obesity. The data below are the most up-to-date data on the rates of adult obesity in America.
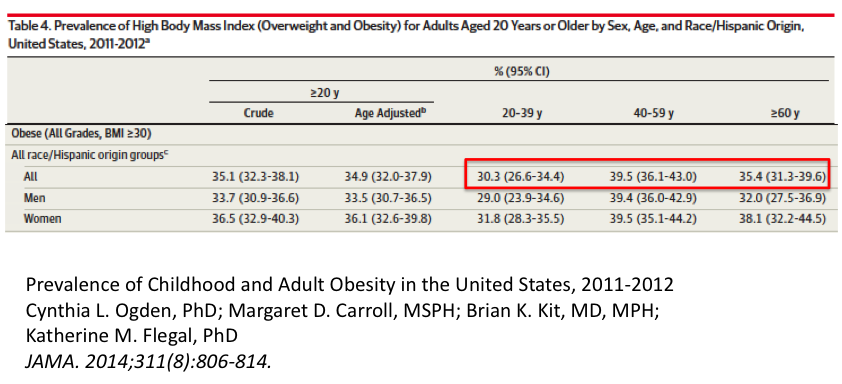
The Table below (Extracted from the tables above and others in the article) shows the obesity rates in adults for 2011-2012. The rates for the groups specified were:
Adolescents, 12 to 19 years old 20.5 %
Young adulthood, 20 to 39 years old 30.3 %
Full Adulthood, 40 to 59 years old 39.5 %
Obesity in young adulthood. The 2011-2012 data show a large increase in obesity in going from adolescents (20.5%) to young adulthood (30.3% obesity). This increase is somewhat understandable considering the transition to a more complex life as young adults enter the workforce and start families. Both of these life events present with large increases in time commitments, and therefore, the time available to prepare healthy foods in the home decreases, and the time that can be committed to exercise also decreases. When you add in the fact that a large percentage of jobs involve sedentary circumstances because of the need to sit at computers for long periods of time, the amount of total exercise is decreased even further. The long work hours common to many entry level jobs means that less time is available to prepare healthy foods and therefore, the reliance on prepared foods and take out food transforms the diet to one containing a large percentage of high fat, high carbohydrate, calorie dense meals.
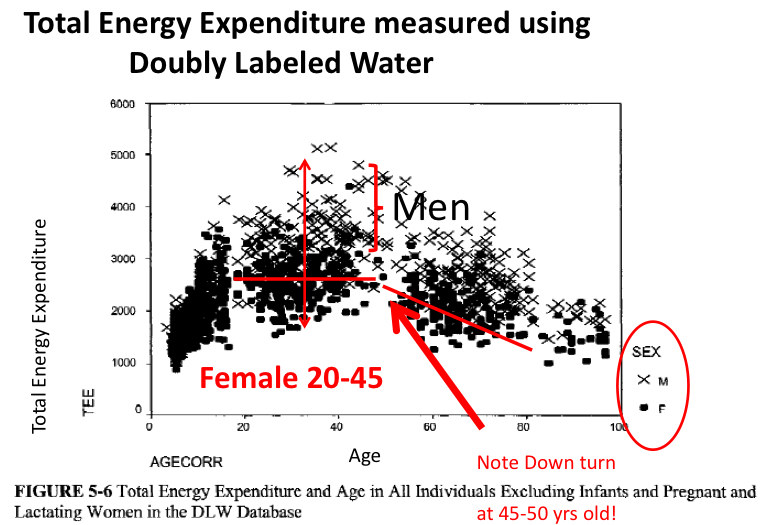
Obesity in full adulthood. There is a further increase in obesity from young adulthood (30.3% obesity) to full adulthood, 40 to 59 years old (39.5 % obesity). It is not hard to imagine that many in this group have been obese for some time and have not exercised sufficiently for many years. Starting at the age of 45 years old, there is a decrease in total energy expenditure (See Slide below) that is usually linked to a decrease in basal metabolism but also may be due to a lower basic activity level. In general, adults in this group start to lose lean muscle mass that contributes both to basal metabolic rate and the amount of energy expended with movement.
Certainly in full adulthood, the end result of being obese, having a lower activity level for many years, and having a decline in total energy expenditure, is an increase in the progression of obesity, and simultaneously, these factors make attempts to lose weight in full adulthood extremely difficult, if not impossible.
What about other hypotheses for the increase in obesity in the US over the past 40 years?
There are certainly some metabolic scenarios that could influence the increase in obesity in certain individuals. Whatever the metabolic situation that is being evoked, one cannot imagine that this metabolic condition arose since the year 1969, or increased since 1969, when the rise in obesity started to increase in the United States.
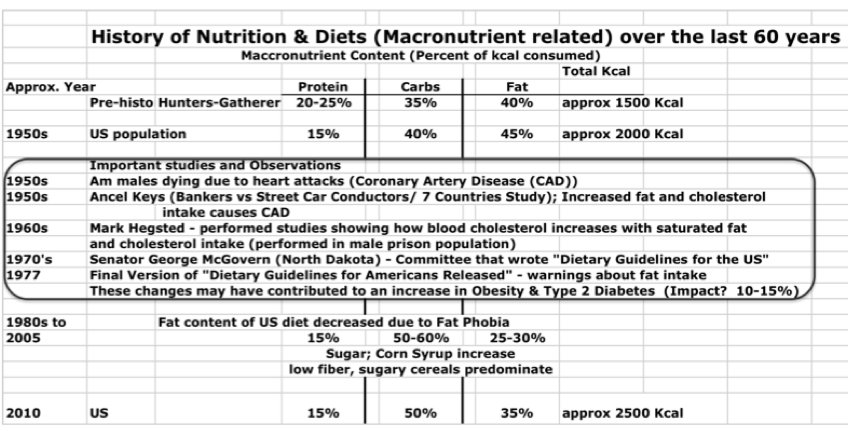
Some researchers and journalists have hypothesized that a change in the macronutrient composition of the American diet, starting approximately in the 1960s, may be behind the steady increase in obesity in the US. The changes in macronutrient content of the diet are depicted below. The increase in the carbohydrate content of the diet led to the increased consumption of glucose and other monosaccharides that may have stimulated insulin secretion from the pancreas.
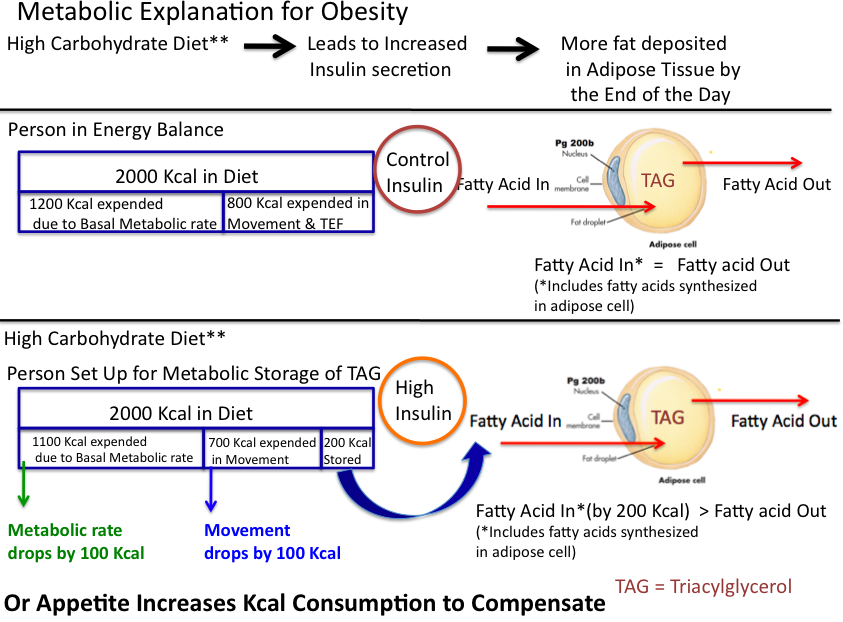
In the slide depiction below, according to this scenario, higher insulin levels lead to a situation where more energy is stored in adipose, and thus there is a siphoning of energy nutrients to storage in the adipose, leading to either 1) less energy for basal metabolism and movement, or 2) an increase in hunger that increases total energy consumption in order to compensate for the energy that was siphoned by the adipose. Certainly it is possible that high insulin levels may stimulate the storage of energy in adipose when there is a concomitant lower release of fatty acids from adipose during the course of the day. This would increase the intake of calories to replace what was stored, and as days go by, more and more fat would accumulate in adipose.
However, it is difficult to envision that this metabolic mechanism is involved in the development of obesity in early childhood, 0 to 5 years old, or even in the development of obesity in late childhood, 6 to 11 years old, or in adolescents, 12 to 19 years old.
Increased adipocyte number hypothesis. One metabolic situation that has been discussed for over 60 years is often evoked to explain why, after becoming obese, it is so difficult to lose weight. This hypothesis is called the “set point” hypothesis, and it posits that once a certain level of obesity is achieved, the body comes to a new set point and “wishes” to maintain this new level of energy.
This hypothesis was updated when it was discovered that early obesity leads to increased numbers of adipocytes (fat cells) in the body, and that later in life, these adipocytes are programmed to become full of fat in order to maintain an energy store in case of times of deprivation. Therefore, the “set point” hypothesis posits that the drives to eat are enhanced until all the fat cells are filled. Some aspects of the “set point” hypothesis have been verified using many techniques, and it is probably true to state that most adipose researchers consider the “set point” theory to be operating under certain circumstances.
Conclusions
Considering all that was discussed above concerning the increas in obesity, we can develop a few leading reasons why the US population has become much more obese in the past 40 years. Therefore, some suggestions on how to combat obesity can be made.
Early childhood is where the obesity epidemic starts. Certainly, obese children make up a population that will become much more obese in the years ahead. Therefore, everything that will prevent childhood obesity should be attempted in order to stop obesity where it begins. Many of the ideas on how to do this have been presented throughout this blog. The class is now in the process of developing additional strategies!
Next, actions must be taken to attack the development of obesity in late childhood, 6 to 11 years old, and in adolescents, 12 to 19 years old. If we can stop obesity in these groups, we may have a chance to prevent obesity in most Americans above the age of 20. But if we do not stop the development of obesity in children and adolescents, we will have no chance to stop the overall obesity epidemic in the United States.
A Moment in Time; Were Americans that Thin in 1969? A Post by Joseph Dixon, April 8, 2014
If any of you wish to remember how thin people were back in 1969, or if you are too young and wish to see this for the first time, please look at the movie “Woodstock” on YouTube (turn down the sound if you do not like rock & roll!; also, don’t look if you are upset by nudity, even if it is for science!). You will be absolutely amazed how thin teenagers and young adults were back then. Of course, you will see some heavy people, too (but very few), as there have been heavy people in most generations (probably because it is an evolutionary survival mechanism). The following are collages of screen shots taken from the Movie, “Woodstock.” But to get the full effect, you must go look at the movie to see how thin people were in 1969!


As someone who was very heavy as a child, I was happy to find this shot of me in college. The photograph below shows me with my roommates in our senior year (1976) of college at SUNY-Binghamton. We are outside of our house reenacting a famous album cover. I am the first in line and I was thin through the last portion of high school and all through college because I changed my eating habits and became very active, including backpacking throughout the entire western US when I was just nineteen years old.

Psychological Aspects of Adult Obesity: Perceptions of Beauty, The Stigma Experienced, and the Toll on Overall Health, a Lecture by Dr. Charlotte Markey, Ph.D., April 2, 2014

Dr. Charlotte N. Markey
Associate Professor
Chair, Department of Psychology
Rutgers University
Camden NJ 08102
Website: http://markey.rutgers.edu/
Dr. Charlotte Markey is a psychologist who studies social influences on eating-related behaviors (i.e., eating, dieting, body image). Some of her projects include the romantic partners’ role in eating-related behaviors, parents’ influences on their children’s eating-related behaviors and media influences on body image. Dr. Markey’s current research also involves the investigation of young adult heterosexual couples, gay, and lesbian couples and the roles that their relationships and personalities play in influencing their health.
Dr. Markey began her lecture by asking the students to comment on a series of photographs she projected on the screen. Each photograph contained a thin adult and an overweight/obese adult. The purpose of the exercise was to relate and discuss the perceptions that emanated from the images and that were picked up by the students.
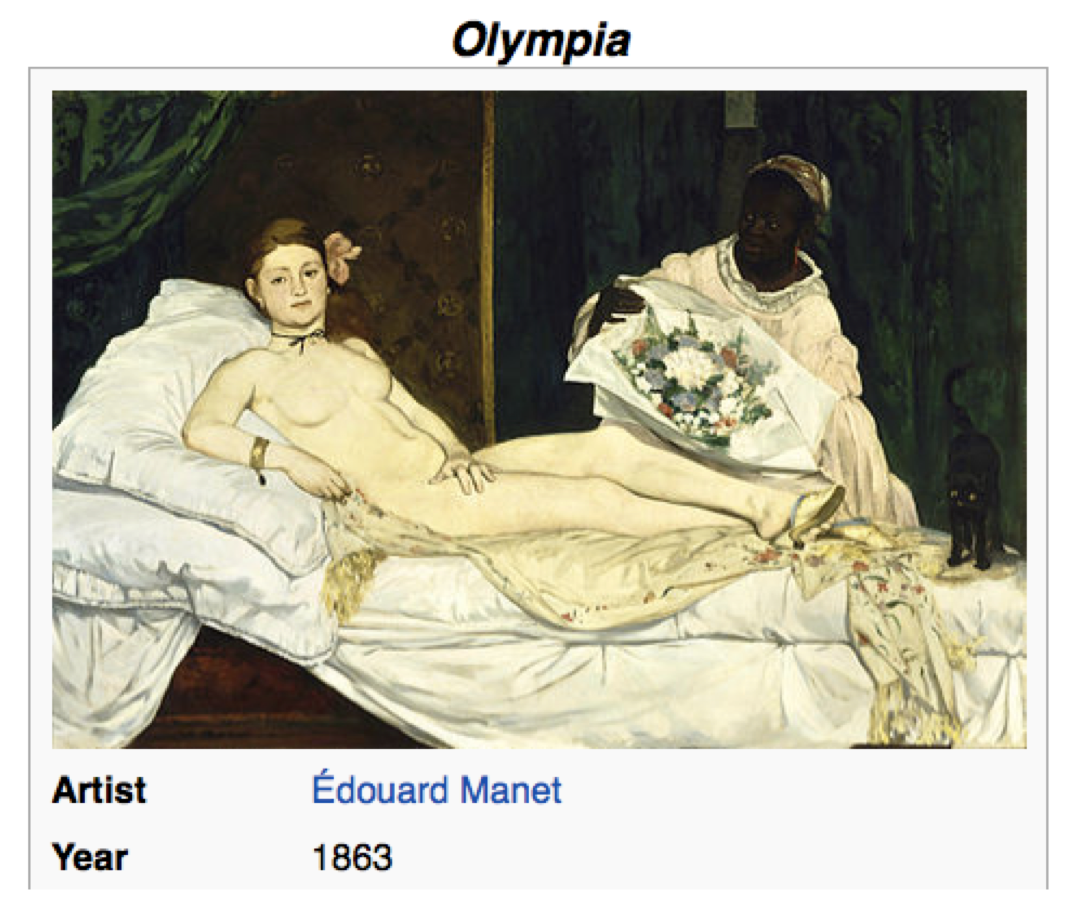
Next, Dr. Markey discussed “Standards of Attractiveness” and how they have changed over time. Dr. Markey put up the painting “Olympia” by Manet, and related how, at the time (1863) it was painted, the painting was criticized because the woman depicted was thought to be extremely thin, if not suffering from under nutrition.
Dr. Markey reviewed dieting and its psychological toll on dieters. Dieting can cause more problems than initially accounted because if people who attempt a diet fail, then the repercussions from the failure can lead into a spiral of depression and self guilt. Dr. Markey discussed her insights into the psychology behind dieting and reactions to failure.
The next topic was the differences in perception experienced by obese men compared to obese women. Obese men generate an average of $1000/year more in medical costs than normal weight men, whereas obese women accumulate approximately $3000/year more in medical costs compared to women with a BMI below 30. Another difference is that men feel bias from others towards their obesity starting at a BMI of 35, whereas women experience bias from others at a much lower relative weight, starting at a BMI of 27, which is still in the over weight category. These differences in perception are responsible for the importance each sex places on having an acceptable body weight and image.
At this point in the lecture, Dr. Markey played a 10 min segment of the HBO documentary on Obesity; Available on You tube:
http://www.youtube.com/watch?v=-pEkCbqN4uo
The segment of the documentary Dr. Markey played addressed the stigma experienced by people who are obese. Quite honestly, it was heart breaking to watch and hear the interviews with the obese subjects.
Next, the topic of who’s at fault if one is obese was discussed in class. Is it the obese person’s fault? Is it the environment’s fault? Does the government play a role? Is it the individual’s problem? Or is it a societal problem?
Dr. Markey explained that one reason some people feel it is acceptable to be cruel (as documented in the HBO film) to obese individuals is that these people hold the basic belief that it is the obese person’s personal responsibility for their weight gain, and therefore, that particular individual should be personally blamed for their lifestyle choices leading to obesity. But is it the case that the obese person actually has a real choice to live a lifestyle that leads to obesity? What if the obese person is truly driven by forces (such as a sustained, unrelenting appetite) that they can’t control? If this is the case, is it their personal fault for being obese? This topic is extremely complex and there are many issues involved. To help with the discussion, Dr. Markey concentrated on the short story she assigned: “The Fat Girl,” by Andre Dubus
Click to access The-Fat-Girl-297rfhc.pdf
There was a lengthy class discussion concerning Dubus’ famous short story! Please go to the website above and download the pdf of the story!
Dr. Charlotte Markey also assigned the following articles to read for the class:
Puhl RM, Heuer CA., The stigma of obesity: a review and update. Obesity (Silver Spring). 2009 May;17(5):941-64.
http://onlinelibrary.wiley.com/doi/10.1038/oby.2008.636/abstract;jsessionid=07D3F384C87BB6DBD98A1F45F5AEC641.f02t03
Markey PM, Markey CN., Annual variation in Internet keyword searches: Linking dieting interest to obesity and negative health outcomes.
J Health Psychol. 2013 Jul;18(7):875-86
http://hpq.sagepub.com/content/early/2012/09/19/1359105312445080
To learn more about Dr. Charlotte Markey’s research, please visit her website at:
Roles of the Supplemental Nutrition Assistance Program (SNAP) and the Accompanying Education Programs in the Health and Nutrition of the Food Insecure, a Lecture By Dr. Debra Palmer, Ph.D., March 26, 2014

Dr. Debra M. Palmer, M.Ed., Ph.D.
Associate Professor
Department of Nutritional Sciences
Extension Specialist in Community Nutrition
Rutgers University
Dr. Debra M. Palmer’s research in nutrition involves issues regarding household food insecurity; the evaluation of innovative methods of providing nutrition education; and incorporating physical activity education into nutrition education venues. As a member of the Nutrition Sciences faculty, Dr. Palmer teaches several graduate level courses on community nutrition. Additionally, Dr. Palmer oversees two statewide nutrition education programs targeted toward limited-resource, diverse, urban audiences (NJ Supplemental Nutrition Assistance Education SNAP-Ed) and the NJ Expanded Food and Nutrition Education Program (EFNEP). Dr. Palmer also is a member of a Multi-State Research Project on the topic of omega-3 consumption, for which she is leading the development and testing of a USDA consumer website on this project.
Dr. Palmer will discuss the roles of the two programs she directs on the nutrition awareness of the urban populations in New Jersey served by the programs. Dr. Palmer assigned two article to be read in preparation for her discussion:
Dinour LM, Bergen D, Yeh MC.
The food insecurity-obesity paradox: a review of the literature and the role food stamps may play.
J Am Diet Assoc. 2007 Nov;107(11):1952-61.
http://www.journals.elsevierhealth.com/periodicals/yjada/article/S0002-8223%2807%2901616-1/fulltext
Metallinos-Katsaras E, Must A, Gorman K.
A longitudinal study of food insecurity on obesity in preschool children.
J Acad Nutr Diet. 2012 Dec;112(12):1949-58.
http://www.andjrnl.org/article/S2212-2672%2812%2901514-6/fulltext
(You will need to obtain the full article through Rutgers Libraries)
Dr. Palmer’s Lecture:
As described in her research interests above, Dr. Palmer is an amazing health professional whose life’s work is to help lower income people have better health through improved nutrition. But even more interesting is Dr. Palmer’s own life story and educational path to become a Professor at Rutgers University.
Dr. Debra Palmer grew up in the inner city of Cincinnati, Ohio. She realized that she needed to go to college in order to break out of the cycle of poverty and, as a single mother, to give her son a better life and insurance (he was asthmatic). Dr. Palmer went to college for aerospace engineering. During this time she needed food stamps to supplement her and her son’s diets. After obtaining her undergraduate degree, Debra taught physics and chemistry in high school in inner city schools. During this time, Dr. Palmer came to the conclusion that most inner city children had no idea how to successfully navigate modern society and she decided to change her educational goals to specifically help the children of the inner city.
Dr. Palmer obtained 2 Master degrees, one in Education and the other in Nutrition. And later she went on to obtain a Ph.D. degree in Nutrition from Penn State University. During her Ph.D. studies, Dr. Palmer became familiar with government programs that were designed to help prevent hunger in the poor. One of them was Supplemental Nutrition Assistance Program – Education (SNAP-Ed, this was the education portion of the program formerly known as the food stamp nutrition education program (FSNE)). The other program was the Expanded Food and Nutrition Education Program (EFNEP). This program was specifically designed to help provide nutrition education to families with children.
After Dr. Palmer graduated with her Ph.D. and moved to New Jersey for a faculty position in Nutrition, she set about using her knowledge to bring SNAP-Ed to New Jersey, and to make these government educations programs efficient and helpful to the populations in New Jersey they were meant to serve. Having grown up in the inner city and having received food stamps while she was in college, Dr. Palmer was aware of the special problems that face poor people in urban areas.
Her strategy included three major operational tracts:
1) She studied the Federal laws so that the State of New Jersey could obtain the maximal amount of funds for nutrition education from the different legislation bills passed by Congress.
2) Dr. Palmer used her knowledge of the difficulties of urban city living to develop effective educational tools and plans. This has even progressed to the the production of educational videos that promote healthy practices, such as exercising at home. See http://www.snaped4me.org
3) Finally, Dr. Palmer hired and trained an army of people from the different communities all over the state (people with high school diplomas (but not bachelor degrees)) and trained them to teach in the community, and along the way, to become successful Rutgers University employees, who were eligible to take college classes in order to work toward college degrees. Over the last 10 years she estimates she has obtained a 66% success rate in hiring competent and loyal community workers for her programs.
Dr. Palmer further discussed her unique insights into how these federal programs help as many people as possible attain proper nutrition.
Please visit these websites for more on Dr. Palmer’s programs:
The CDC Data Trove: Associations between Inactivity, Obesity, and the Diagnosis for Type 2 Diabetes, Posted by J. Dixon, March 18, 2014
During her lecture, Dr. Yanhong Jin presented data from the Centers for Disease Control (CDC) concerning inactivity throughout the United States. The CDC data are remarkable, and one can easily go to the CDC website in order to view PowerPoints that show the year by year increases in inactivity, as well as the increases in the obesity rates and the increases in the number of diagnosed cases of Type 2 Diabetes.
Website: http://www.CDC.gov/diabetes
I was amazed how the maps for different parameters had similar distributions showing the areas of high incidence of disease throughout the US.
On the next slide I placed the distribution maps for inactivity, obesity, and diabetes on the same slide. The similar distributions are eye opening!

Maps depicting Inactivity, Obesity and Diabetes in 2008
In the following slide, certain regions are demarcated:

Maps of Inactivity, Obesity, Diabetes with seven selected areas
The seven areas indicated on the map are summarized here:
1.The states of Louisiana, Mississippi, Alabama, Tennessee, Kentucky, and West Virginia have high rates of inactivity, obesity, and Type 2 diabetes.
2.Eastern Kentucky and most of West Virginia have extremely high rates of inactivity and obesity (See map close ups bellow).
3.Eastern Oklahoma has a dense area of inactivity, obesity, and diabetes.
4.There is narrow strip in western Arizona and southern Utah that represents the location of various Native American tribes that have high rates of inactivity, obesity, and diabetes.
5.Northern Maine has a region of overlapping high rates of inactivity, obesity, and diabetes.
6.There is a elongated region of central California that represents the central valley that has overlapping high rates of inactivity, obesity, and diabetes. There is much less inactivity along the coast.
7. The one bright spot in the country is Colorado, where there are light areas for all the parameters, thus relatively lower rates of of inactivity, obesity, and diabetes, compared to all other regions of the US.

Close-up of Inactivity Map
The maps (from 2008) depict extremely strong data that point convincingly to the role of inactivity in the obesity epidemic. Why are these areas especially prone to inactivity and obesity? The answers are complex and differ from state to state and area to area. Obesity is also the result of other factors such as healthy food deserts and an obesogenic built environment. Some of the possible non-nutrition reasons for the high rates of low inactivity are listed below:
1.High inactivity in areas of the deep South may be due to high summer temperatures and humidity, forcing people to stay indoors in air conditioning.
2.High summer temperatures and humidity may be the reason for high inactivity in Eastern Oklahoma and Eastern Kentucky and most of West Virginia, too.
3.Northern Maine may have the opposite situation where the very long, cold winters keep people inside.
4.The narrow strip in eastern Arizona is populated by native American tribes that live on reservations that are located in areas with extremely high summer temperatures. In addition, it is well known that Native Americans have “thrifty” metabolism that leave them susceptible to obesity on a “western type diet.”
5.The State of Colorado is a region of higher relative activity and, therefore, is somewhat resistant to the increase in obesity found in other areas of the US.
Conclusion: As reported by Dr. James Levine of the Mayo Clinic, inactivity is a major causative factor for the current obesity epidemic.
Transitional Factors that Cause the Simultaneous Presence of Undernutrition and Obesity in Developing Countries, a Lecture by Dr. Dan Hoffman, Ph.D., March 12, 2014

Dr. Dan Hoffman, Ph.D., Associate Professor, Department of Nutrition Sciences, Rutgers University
Dr. Hoffman studies the biological and environmental factors that cause obesity. His research investigates how changes in substrate oxidation may predispose an individual to an increase in body fat. Dr. Hoffman collaborates with the University of São Paulo, Brazil and the University of Southampton, UK in the study of two large, unique cohorts. In Brazil, Dr. Hoffman follows a cohort of over 600 children in the shanty towns of São Paulo in order to discern the factors that affect nutrition and health in this population.
Dr. Hoffman is also involved in evaluating the roles of an influx of multinational supermarkets on obesity in transitional countries such as Bulgaria. The aim of this research is to determine the parameters that dictate whether an individual will shop exclusively at a large supermarket versus a traditional public market.
In his lecture, Dr. Hoffman first discussed the current state of nutrition throughout the Developing world. Countries discussed were China, Korea, countries in Africa, and countries of the former Soviet Union. Then Dr. Hoffman discussed his own research on nutrition and children in São Paulo, Brazil.
Developing countries are currently facing the dual problems of undernutrition and obesity within the same population. Poor nutrition is often reflected by the rate of stunting in the population of a particular country. Stunting occurs when there is inadequate nutrition in the first few years of life that prevents a growth spurt from occurring. Dr. Hoffman showed the following slide:
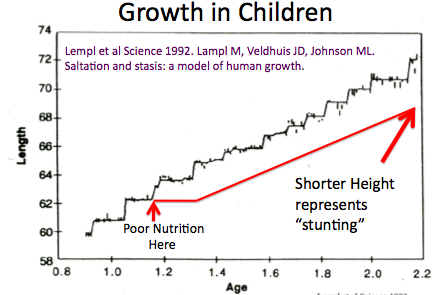
How Stunted Growth Occurs
Children do not grow on a continuous basis, but, in fact, have growth spurts at specific times in the first few years of life. The slide depicts that undernutrition during one of these growth spurts can lead to limited growth at that particular time leading to stunting in the young adult and adult.
At the same time as incidents of undernutrition in certain areas of the country, there is now occurring throughout the developing world, movement of people from rural areas to cities.
In so doing, people who are new to urban life are more prone to become obese because they no longer walk as much as they did in the rural areas, and their diet changes from locally grown food to food (often fast food) purchased in shops. An example of this is shown in the figure below:
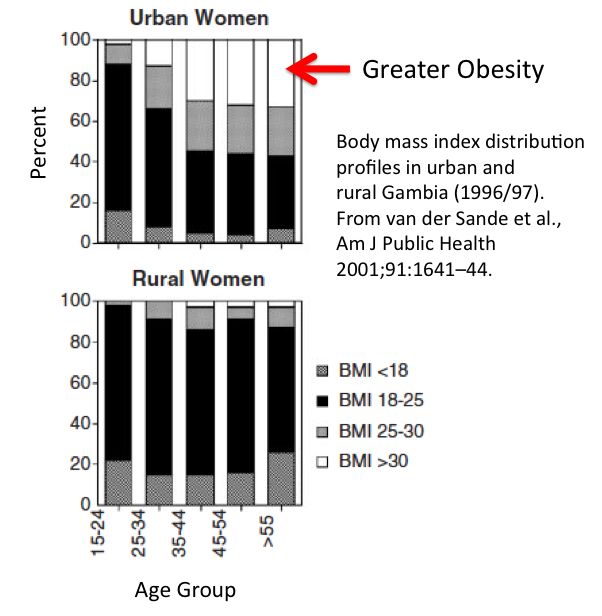
Transition to Obesity in Gambia
Dr. Hoffman assigned the following articles for the class to read:
Andrew M Prentice. The emerging epidemic of obesity in
developing countries. International Journal of Epidemiology 2006;35:93–99
http://ije.oxfordjournals.org/content/35/1/93.long
Daniel J. Hoffman , Dylan J. Klein. Growth in transitional countries: The long-term impact of under-nutrition on health. Annals of Human Biology
September-October 2012, Vol. 39, No. 5 , Pages 395-401
Available through Rutgers Libraries
Read More: http://informahealthcare.com/doi/abs/10.3109/03014460.2012.705893
Role of the Physical Environment in Obesity, A Lecture by Dr. Yanhong Jin, Ph.D., March 5, 2014

Dr. Yanhong Jin, Ph.D., Associate Professor, Department of Agricultural, Food and Resource Economics, Rutgers University
Website: http://yjin.rutgers.edu
Dr. Jin’s research involves the role of the Physical Environment on the rates of obesity in the United States.
The Physical Environment is defined as our current structured environment where people (adults and children) live, eat, play, shop, work, and attend school. Therefore, the Physical Environment includes the Neighborhood food environment, Neighborhood parks and playgrounds, Neighborhood walkability, Neighborhood public transportation, and Neighborhood safety. The Physical Environment, in most cases, cannot be altered unless the individual and family move to a new location.
Dr. Jin discussed the most recent data on obesity in children and presented this slide:
Dr. Jin discussed her own research on the role of neighborhood parks on obesity in children. Her published article can be found at:
http://ajae.oxfordjournals.org/content/early/2013/08/06/ajae.aat047.full

Dr. Jin used the 2007 National Survey of Children’s Health (NSCH) to determine what effects the presence of a neighborhood park had on the obesity rate of children. Dr. Jin and her co-author found that the effects of a park/playground on childhood obesity was dependent upon the gender, age, race, household income level, neighborhood safety, and other neighborhood amenities. Of high importance was the safety of the neighborhood.
The following received more benefit from a safe neighborhood park:
1. The benefit was greater in girls than boys
2. The benefit was greater in the age 10 – 13 group
3. Non-Hispanic white youth benefited more than other groups
4. Children in unsafe neighborhoods benefited more
The take home message from Dr. Jin’s lecture was that we need to consider the environment people live in when strategies to combat the obesity epidemic are developed.
Obesity: Control of food intake, including the endocannabinoids. Also, a review of: “The Extraordinary Science of Addictive Junk Food,” by Michael Moss
A lecture was presented by Joe Dixon on February 26, 2014 on the subject of the control of food intake in humans. This area has now been researched for over sixty years and we are still in the infancy of understanding this complex process. However, it is evident that the food companies have made significant discoveries concerning what makes humans crave certain foods. The reading assignment for this week was “The Extraordinary Science of Addictive Junk Food,” by Michael Moss, published February 20, 2013 in the New York Times Magazine. Michael Moss is an investigative reporter for The NY Times and he won a Pulitzer Prize in 2010 for his news reports concerning the meat industry. The article was adapted from “Salt Sugar Fat: How the Food Giants Hooked Us,” published in 2013 by Random House.

Michael Moss of the New York Times
Here is short summary of Mr. Moss’ article:
What makes this article, and the book which it is exerpted from, so powerful is that Mr. Moss was able to obtain documents that support this entire story. Michael Moss stated, “What I found, over four years of research and reporting, was a conscious effort — taking place in labs and marketing meetings and grocery-store aisles — to get people hooked on foods that are convenient and inexpensive.” Mr. Moss interviewed over 300 people who had been involved, or were still involved, with the food industry. In this article, he relays examples of how certain foods were formulated to make products irresistible to consumers. Foods that he mentioned in the magazine article were Dr. Pepper soft drink, Prego spaghetti sauce, Lunchables with dessert, the line extension for Lay’s potato chips, and several other major processed foods.
Mr. Moss’s article begins with a recap of a one-day meeting in 1999 of major food executives. In a presentation by a vice president of Kraft, named Michael Mudd, it was posited that the high rates of childhood and adult obesity were in part due to products supplies by the major food companies. Mr. Mudd suggested that one way to combat obesity included lowering salt, fat, and sugar in their products, and pulling back on their advertizing of packaged and front line food products. However, later in the same meeting, Stephen Sanger, CEO of General Mills, indicated that General Mills would not change course and that he would not alter recipes that had been formulated. The possibility that major food companies would do their part to fight the obesity epidemic was definitely deflated in this meeting.
Here are some major food products that Mr. Moss discusses in his article:
For Dr. Pepper, Moss saw the report where Howard Moskowitz, a food industry consultant, detailed how to increase the acceptance of Dr. Pepper by consumers. He even cited specific pages in the report where Moskowitz described how to increase the allure of Dr. Pepper.
We learn that in Prego spaghetti sauce, after tomatoes, sugar was made the next greatest ingredient in amount.
One extremely revealing story was that the grandchildren of Bob Drane, the man who invented Lunchables, did not seem to eat them because their mother, Drane’s daughter, indicted that her family “eat very healthfully.”
One interesting strategy that all of us who spend time in major supermarkets are aware of is the line extension, where products such as the original Oreos morphed into over thirty different “Oreo” varieties. The possibility of finding that perfect Oreo was enhanced many fold!
In the case of potato chips, food industry scientists again followed the food industry’s very effective strategy (line extension) to increase the sales of well-known products. In this case, the classic Lay’s potato chip brand was extended to include cousins such as chips with salt & vinegar, salt & pepper, cheddar, and sour cream flavoring. Mr. Moss goes on to describe how Frito-Lay executives hope to develop “designer sodium,” which may decrease the sodium content of their products by a considerable amount.
Moss ended his article by writing about Jeffrey Dunn, who was trying to stimulate interest in selling carrots to consumers using tactics he learned in the food industry. However, Mr. Dunn had been an executive with the Coca-Cola Company, where he was the president and chief operating officer for the regions of North and South America. One of the executives who worked with Mr. Dunn at the time described to Mr. Moss that Coca-Cola’s goal was to “outsell every other thing people drank, including milk and water.” Certainly, this comment brings to mind the Empire in the Star Wars Trilogy!
An interview of Michael Moss conducted by Johannah Sakimura, one of the students in this class, can be viewed at:
http://www.everydayhealth.com/weight/unholy-trinity-behind-junk-food-michael-moss.aspx
Is lower ability to burn fatty acids in muscle a contributor to adult obesity? A Lecture presented by Dr. Greg Henderson
Gregory C. Henderson, Ph.D.
Assistant Professor
Department of Exercise Science & Sport Studies
School of Art and Sciences
Rutgers University
http://www.exsci.rutgers.edu/faculty/full-time-faculty/441-gregory-henderson

Dr. Henderson’s research is focused upon effects of exercise on macronutrient metabolism in humans. Differences between men and women, and effects of aging are of central interest. Dr. Henderson’s approach is to administer non-radioactive stable isotope-labeled metabolites (tracers) followed by mass spectrometry based analyses of blood and muscle samples.
Dr. Henderson assigned two articles to be read for his lecture on February 19, 2014:
Intramuscular lipid oxidation and obesity
Joseph A. Houmard
American Journal of Physiology – Regulatory, Integrative and Comparative PhysiologyPublished 1 April 2008Vol. 294no. R1111-R1116
http://ajpregu.physiology.org/content/294/4/R1111
Impaired plasma fatty acid oxidation in extremely obese women
John P. Thyfault , Raymond M. Kraus , Robert C. Hickner , Amy W. Howell , Robert R. Wolfe , G. Lynis Dohm
American Journal of Physiology – Endocrinology and Metabolism Published 1 December 2004 Vol. 287no. E1076-E1081
http://ajpendo.physiology.org/content/287/6/E1076
John Thyfault and his research team tested the hypothesis that muscle is less able to oxidize fatty acids in obese women. The study design was that fatty acid oxidation was measured in lean control women (BMI = 23), and this was compared to fatty acid oxidation in obese subjects (BMI = 41). Another group studied was comprised of obese women who had undergone postgastric bypass surgery and had lost weight (> 45 kg), and their weight was stable at least a year after the surgery (BMI = 34). All of the women were given fatty acid tracers in order to measure fatty acid oxidation in both resting and exercise conditions. The results were astounding. Obese women had about 25- 33% lower oxidation of fatty acids compared to controls, at rest and during exercise. Moreover, the women who had lost weight still presented with reduced rates of fatty oxidation compared to the controls. In fact, their fatty acid oxidation was very similar to the obese women who had not lost any weight.
This study demonstrates that obesity is associated with a lowering of the capacity to oxidize fatty acids, primarily in skeletal muscle. The main question raised by this article is, did the defect in fatty acid oxidation in obesity come first, and then the subjects became obese? Or did the defect in fatty acid oxidation occur only after the onset of obesity? This question is extremely difficult to answer, but Dr. Henderson felt that the lower fatty acid oxidation in obesity developed second, after obesity already was achieved.
What are the main take home points from this research?
1. No matter which came first, obese women have lower rates of fatty acid oxidation than their lean counterparts, and this would make it more difficult for obese patients to lose weight with exercise.
2. Therefore, it is especially important not to become obese in the first place, because once it occurs, the lowering of fatty acid oxidation in muscle makes it that much more difficult to lose weight. The diagram below illustrates this.

The above articles and some of Dr. Henderson’s own research will be discussed during the lecture.
Compared with that of MUFA, a high dietary intake of n-3 PUFA does not reduce the degree of pathology in mdx mice.
Henderson GC, Evans NP, Grange RW, Tuazon MA.
Br J Nutr. 2014 Feb 13:1-10.
Determinants of resting lipid oxidation in response to a prior bout of endurance exercise. Henderson GC, Alderman BL.
J Appl Physiol (1985). 2014 Jan;116(1):95-103. doi: 10.1152/japplphysiol.00956.2013. Epub 2013 Nov 14.
Kinetic measurement techniques in the evaluation of lipid metabolism. Henderson GC.
Curr Drug Discov Technol. 2013 Sep;10(3):209-23. Review
StearoylCoA desaturase-5: a novel regulator of neuronal cell proliferation and differentiation. Sinner DI, Kim GJ, Henderson GC, Igal RA.
PLoS One. 2012;7(6):e39787. doi: 10.1371/journal.pone.0039787. Epub 2012 Jun 22.
http://www.plosone.org/article/info%3Adoi%2F10.1371%2Fjournal.pone.0039787


Recent Comments